Skip to ContentGo to accessibility pageKeyboard shortcuts menu
OpenStax Logo

Menu
Table of contents
  1. Preface
  2. 1 Sampling and Data
    1. Introduction
    2. 1.1 Definitions of Statistics, Probability, and Key Terms
    3. 1.2 Data, Sampling, and Variation in Data and Sampling
    4. 1.3 Levels of Measurement
    5. 1.4 Experimental Design and Ethics
    6. Key Terms
    7. Chapter Review
    8. Homework
    9. References
    10. Solutions
  3. 2 Descriptive Statistics
    1. Introduction
    2. 2.1 Display Data
    3. 2.2 Measures of the Location of the Data
    4. 2.3 Measures of the Center of the Data
    5. 2.4 Sigma Notation and Calculating the Arithmetic Mean
    6. 2.5 Geometric Mean
    7. 2.6 Skewness and the Mean, Median, and Mode
    8. 2.7 Measures of the Spread of the Data
    9. Key Terms
    10. Chapter Review
    11. Formula Review
    12. Practice
    13. Homework
    14. Bringing It Together: Homework
    15. References
    16. Solutions
  4. 3 Probability Topics
    1. Introduction
    2. 3.1 Terminology
    3. 3.2 Independent and Mutually Exclusive Events
    4. 3.3 Two Basic Rules of Probability
    5. 3.4 Contingency Tables and Probability Trees
    6. 3.5 Venn Diagrams
    7. Key Terms
    8. Chapter Review
    9. Formula Review
    10. Practice
    11. Bringing It Together: Practice
    12. Homework
    13. Bringing It Together: Homework
    14. References
    15. Solutions
  5. 4 Discrete Random Variables
    1. Introduction
    2. 4.1 Hypergeometric Distribution
    3. 4.2 Binomial Distribution
    4. 4.3 Geometric Distribution
    5. 4.4 Poisson Distribution
    6. Key Terms
    7. Chapter Review
    8. Formula Review
    9. Practice
    10. Homework
    11. References
    12. Solutions
  6. 5 Continuous Random Variables
    1. Introduction
    2. 5.1 Properties of Continuous Probability Density Functions
    3. 5.2 The Uniform Distribution
    4. 5.3 The Exponential Distribution
    5. Key Terms
    6. Chapter Review
    7. Formula Review
    8. Practice
    9. Homework
    10. References
    11. Solutions
  7. 6 The Normal Distribution
    1. Introduction
    2. 6.1 The Standard Normal Distribution
    3. 6.2 Using the Normal Distribution
    4. 6.3 Estimating the Binomial with the Normal Distribution
    5. Key Terms
    6. Chapter Review
    7. Formula Review
    8. Practice
    9. Homework
    10. References
    11. Solutions
  8. 7 The Central Limit Theorem
    1. Introduction
    2. 7.1 The Central Limit Theorem for Sample Means
    3. 7.2 Using the Central Limit Theorem
    4. 7.3 The Central Limit Theorem for Proportions
    5. 7.4 Finite Population Correction Factor
    6. Key Terms
    7. Chapter Review
    8. Formula Review
    9. Practice
    10. Homework
    11. References
    12. Solutions
  9. 8 Confidence Intervals
    1. Introduction
    2. 8.1 A Confidence Interval for a Population Standard Deviation, Known or Large Sample Size
    3. 8.2 A Confidence Interval for a Population Standard Deviation Unknown, Small Sample Case
    4. 8.3 A Confidence Interval for A Population Proportion
    5. 8.4 Calculating the Sample Size n: Continuous and Binary Random Variables
    6. Key Terms
    7. Chapter Review
    8. Formula Review
    9. Practice
    10. Homework
    11. References
    12. Solutions
  10. 9 Hypothesis Testing with One Sample
    1. Introduction
    2. 9.1 Null and Alternative Hypotheses
    3. 9.2 Outcomes and the Type I and Type II Errors
    4. 9.3 Distribution Needed for Hypothesis Testing
    5. 9.4 Full Hypothesis Test Examples
    6. Key Terms
    7. Chapter Review
    8. Formula Review
    9. Practice
    10. Homework
    11. References
    12. Solutions
  11. 10 Hypothesis Testing with Two Samples
    1. Introduction
    2. 10.1 Comparing Two Independent Population Means
    3. 10.2 Cohen's Standards for Small, Medium, and Large Effect Sizes
    4. 10.3 Test for Differences in Means: Assuming Equal Population Variances
    5. 10.4 Comparing Two Independent Population Proportions
    6. 10.5 Two Population Means with Known Standard Deviations
    7. 10.6 Matched or Paired Samples
    8. Key Terms
    9. Chapter Review
    10. Formula Review
    11. Practice
    12. Homework
    13. Bringing It Together: Homework
    14. References
    15. Solutions
  12. 11 The Chi-Square Distribution
    1. Introduction
    2. 11.1 Facts About the Chi-Square Distribution
    3. 11.2 Test of a Single Variance
    4. 11.3 Goodness-of-Fit Test
    5. 11.4 Test of Independence
    6. 11.5 Test for Homogeneity
    7. 11.6 Comparison of the Chi-Square Tests
    8. Key Terms
    9. Chapter Review
    10. Formula Review
    11. Practice
    12. Homework
    13. Bringing It Together: Homework
    14. References
    15. Solutions
  13. 12 F Distribution and One-Way ANOVA
    1. Introduction
    2. 12.1 Test of Two Variances
    3. 12.2 One-Way ANOVA
    4. 12.3 The F Distribution and the F-Ratio
    5. 12.4 Facts About the F Distribution
    6. Key Terms
    7. Chapter Review
    8. Formula Review
    9. Practice
    10. Homework
    11. References
    12. Solutions
  14. 13 Linear Regression and Correlation
    1. Introduction
    2. 13.1 The Correlation Coefficient r
    3. 13.2 Testing the Significance of the Correlation Coefficient
    4. 13.3 Linear Equations
    5. 13.4 The Regression Equation
    6. 13.5 Interpretation of Regression Coefficients: Elasticity and Logarithmic Transformation
    7. 13.6 Predicting with a Regression Equation
    8. 13.7 How to Use Microsoft Excel® for Regression Analysis
    9. Key Terms
    10. Chapter Review
    11. Practice
    12. Solutions
  15. A | Statistical Tables
  16. B | Mathematical Phrases, Symbols, and Formulas
  17. Index

1.1 Definitions of Statistics, Probability, and Key Terms

The Data and Story Library, http://lib.stat.cmu.edu/DASL/Stories/CrashTestDummies.html (accessed May 1, 2013).

1.2 Data, Sampling, and Variation in Data and Sampling

Gallup-Healthways Well-Being Index. http://www.well-beingindex.com/default.asp (accessed May 1, 2013).

Gallup-Healthways Well-Being Index. http://www.well-beingindex.com/methodology.asp (accessed May 1, 2013).

Gallup-Healthways Well-Being Index. http://www.gallup.com/poll/146822/gallup-healthways-index-questions.aspx (accessed May 1, 2013).

Data from http://www.bookofodds.com/Relationships-Society/Articles/A0374-How-George-Gallup-Picked-the-President

Dominic Lusinchi, “’President’ Landon and the 1936 Literary Digest Poll: Were Automobile and Telephone Owners to Blame?” Social Science History 36, no. 1: 23-54 (2012), http://ssh.dukejournals.org/content/36/1/23.abstract (accessed May 1, 2013).

“The Literary Digest Poll,” Virtual Laboratories in Probability and Statistics http://www.math.uah.edu/stat/data/LiteraryDigest.html (accessed May 1, 2013).

“Gallup Presidential Election Trial-Heat Trends, 1936–2008,” Gallup Politics http://www.gallup.com/poll/110548/gallup-presidential-election-trialheat-trends-19362004.aspx#4 (accessed May 1, 2013).

The Data and Story Library, http://lib.stat.cmu.edu/DASL/Datafiles/USCrime.html (accessed May 1, 2013).

LBCC Distance Learning (DL) program data in 2010-2011, http://de.lbcc.edu/reports/2010-11/future/highlights.html#focus (accessed May 1, 2013).

Data from San Jose Mercury News

1.3 Levels of Measurement

“State & County QuickFacts,” U.S. Census Bureau. http://quickfacts.census.gov/qfd/download_data.html (accessed May 1, 2013).

“State & County QuickFacts: Quick, easy access to facts about people, business, and geography,” U.S. Census Bureau. http://quickfacts.census.gov/qfd/index.html (accessed May 1, 2013).

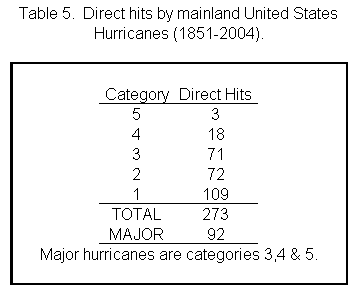
“Table 5: Direct hits by mainland United States Hurricanes (1851-2004),” National Hurricane Center, http://www.nhc.noaa.gov/gifs/table5.gif (accessed May 1, 2013).

“Levels of Measurement,” http://infinity.cos.edu/faculty/woodbury/stats/tutorial/Data_Levels.htm (accessed May 1, 2013).

Courtney Taylor, “Levels of Measurement,” about.com, http://statistics.about.com/od/HelpandTutorials/a/Levels-Of-Measurement.htm (accessed May 1, 2013).

David Lane. “Levels of Measurement,” Connexions, http://cnx.org/content/m10809/latest/ (accessed May 1, 2013).

1.4 Experimental Design and Ethics

“Vitamin E and Health,” Nutrition Source, Harvard School of Public Health, http://www.hsph.harvard.edu/nutritionsource/vitamin-e/ (accessed May 1, 2013).

Stan Reents. “Don’t Underestimate the Power of Suggestion,” athleteinme.com, http://www.athleteinme.com/ArticleView.aspx?id=1053 (accessed May 1, 2013).

Ankita Mehta. “Daily Dose of Aspiring Helps Reduce Heart Attacks: Study,” International Business Times, July 21, 2011. Also available online at http://www.ibtimes.com/daily-dose-aspirin-helps-reduce-heart-attacks-study-300443 (accessed May 1, 2013).

The Data and Story Library, http://lib.stat.cmu.edu/DASL/Stories/ScentsandLearning.html (accessed May 1, 2013).

M.L. Jackson et al., “Cognitive Components of Simulated Driving Performance: Sleep Loss effect and Predictors,” Accident Analysis and Prevention Journal, Jan no. 50 (2013), http://www.ncbi.nlm.nih.gov/pubmed/22721550 (accessed May 1, 2013).

“Earthquake Information by Year,” U.S. Geological Survey. http://earthquake.usgs.gov/earthquakes/eqarchives/year/ (accessed May 1, 2013).

“Fatality Analysis Report Systems (FARS) Encyclopedia,” National Highway Traffic and Safety Administration. http://www-fars.nhtsa.dot.gov/Main/index.aspx (accessed May 1, 2013).

Data from www.businessweek.com (accessed May 1, 2013).

Data from www.forbes.com (accessed May 1, 2013).

“America’s Best Small Companies,” http://www.forbes.com/best-small-companies/list/ (accessed May 1, 2013).

U.S. Department of Health and Human Services, Code of Federal Regulations Title 45 Public Welfare Department of Health and Human Services Part 46 Protection of Human Subjects revised January 15, 2009. Section 46.111:Criteria for IRB Approval of Research.

“April 2013 Air Travel Consumer Report,” U.S. Department of Transportation, April 11 (2013), http://www.dot.gov/airconsumer/april-2013-air-travel-consumer-report (accessed May 1, 2013).

Lori Alden, “Statistics can be Misleading,” econoclass.com, http://www.econoclass.com/misleadingstats.html (accessed May 1, 2013).

Maria de los A. Medina, “Ethics in Statistics,” Based on “Building an Ethics Module for Business, Science, and Engineering Students” by Jose A. Cruz-Cruz and William Frey, Connexions, http://cnx.org/content/m15555/latest/ (accessed May 1, 2013).

Order a print copy

As an Amazon Associate we earn from qualifying purchases.

Citation/Attribution

Want to cite, share, or modify this book? This book uses the Creative Commons Attribution License and you must attribute OpenStax.

Attribution information
  • If you are redistributing all or part of this book in a print format, then you must include on every physical page the following attribution:
    Access for free at https://openstax.org/books/introductory-business-statistics/pages/1-introduction
  • If you are redistributing all or part of this book in a digital format, then you must include on every digital page view the following attribution:
    Access for free at https://openstax.org/books/introductory-business-statistics/pages/1-introduction
Citation information

© Jun 23, 2022 OpenStax. Textbook content produced by OpenStax is licensed under a Creative Commons Attribution License . The OpenStax name, OpenStax logo, OpenStax book covers, OpenStax CNX name, and OpenStax CNX logo are not subject to the Creative Commons license and may not be reproduced without the prior and express written consent of Rice University.